CATEGORY:
Open Data
Filtering and pivot tables
Course Access: Lifetime
Free
Course Overview
Once your data is organised and clean, you can now begin to filter and analyse the data.
In this module we will learn how to:
- Sort and filter data in a spreadsheet
- Apply formula to generate simple statistics
- Create a number of pivot tables
- Create a number of summary graphs
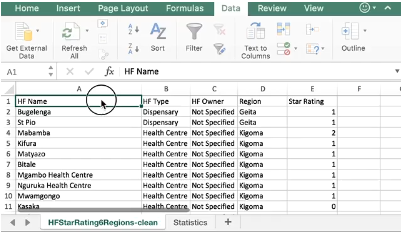
To prepare you for this exercise you will need this spreadsheet. Note that it has two sheets; the first tab holds the data, and the second tab called ‘Statistics’ will be used when we look at formula.