Introduction to Open Data
In this course we’ll explore the following 3 topics:
- What is Open Data;
- What is open data?
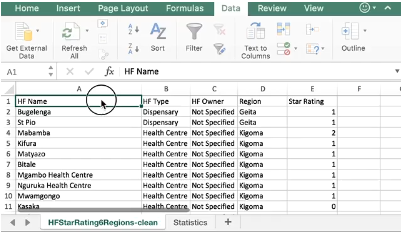
- What is data?
- What makes data open?
- Why do we need open data?
- Unlocking the Value of Open Data
- Innovation and growth in businesses
- Opportunities for governments
- Impact on society and public policy
- Benefits for culture and the environment.
- Finding hidden data on the Web
- How to locate hidden data
- What benefits hidden data can provide
- How to obtain hidden data